AI Mobile Coders
One SDK for Android, iOS, Flutter, React Native and KMP: A Deep Dive Into Measure, the Open Source Crashlytics Alternative

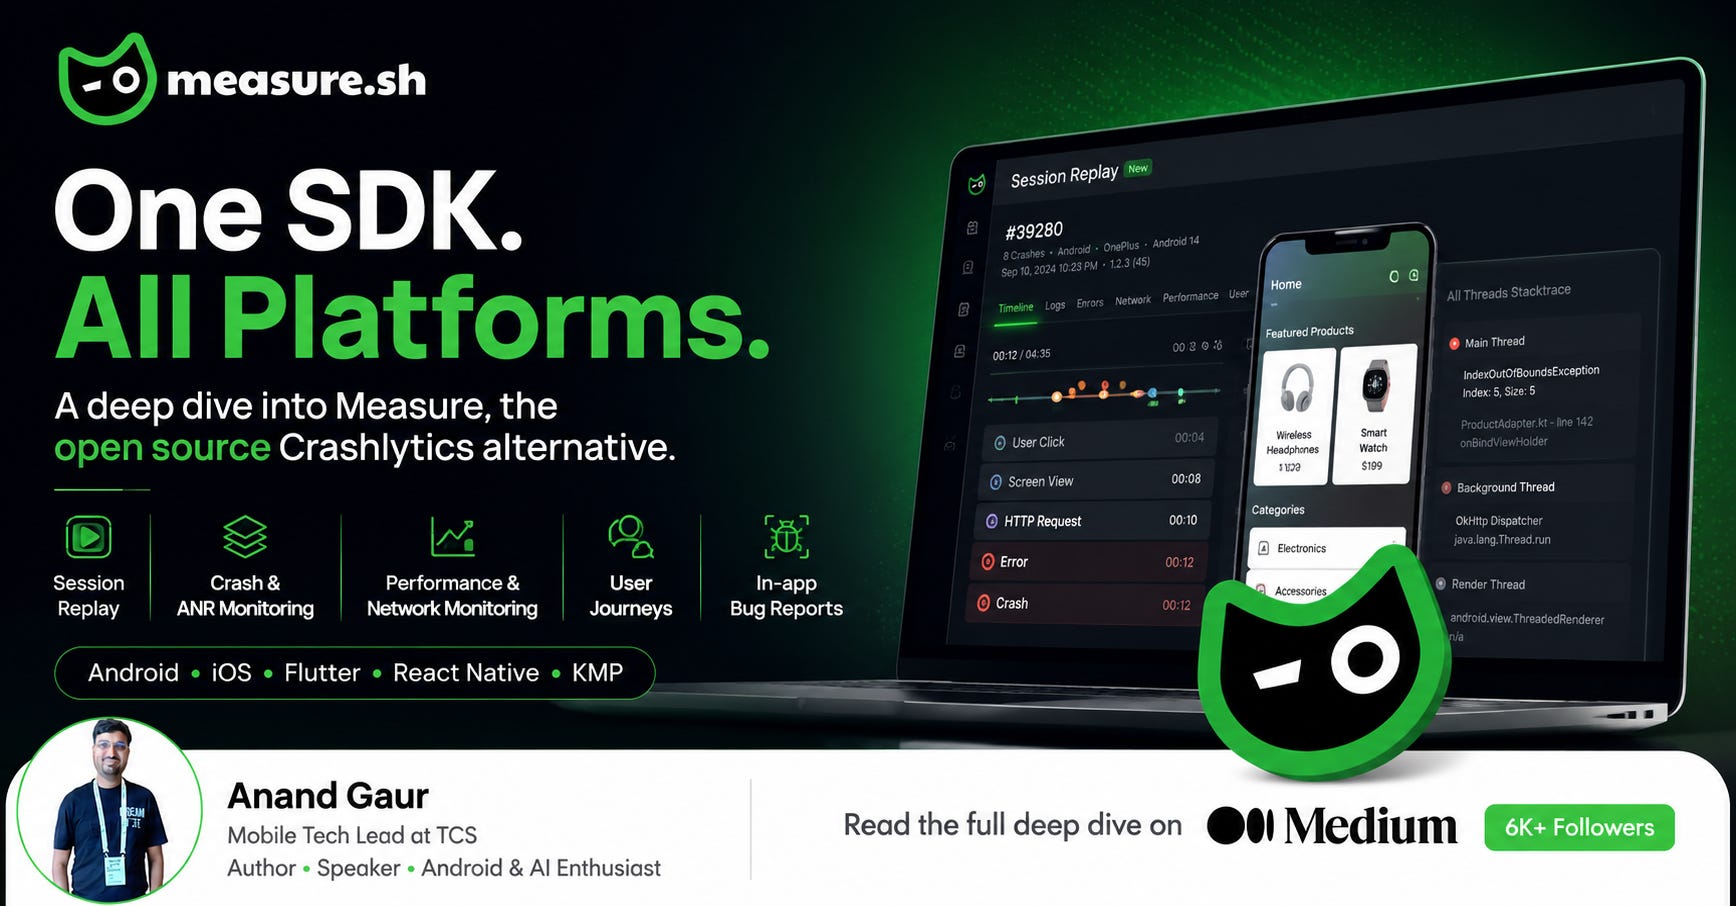
Crashlytics tells you what broke. It rarely tells you why. And if your team ships on more than one stack, it tells you that in five different places.
Every mobile developer knows this feeling.
It is 11 PM. A release went out three hours ago. Crashlytics shows a spike, and there it is: IndexOutOfBoundsException in a list adapter, 340 users affected, crash-free rate down from 99.6 to 98.1 percent.
You open the issue. You get a stack trace. You get a device model, an OS version, a memory reading, and maybe four breadcrumbs that someone on your team added eight months ago and never updated.
And then you sit there and ask the only question that actually matters: what was the user doing?
Crashlytics does not answer that. Not because it is a bad tool, it is a genuinely great crash reporter and it is free, but because answering that question was never its job. The rest of the job got scattered across Google Analytics, Performance Monitoring, BigQuery exports, Cloud Functions and whatever third party bug reporting tool your team bolted on.
Now multiply that by your stack count. Android team here. iOS team there. A Flutter app for one product line. A React Native app that came in through an acquisition. Same problem, five times over, with five different debugging cultures.
This blog is a deep look at Measure, an open source, mobile first monitoring platform that covers Android, iOS, iPadOS, Flutter, React Native and Kotlin Multiplatform
1. The hidden tax of “free”
Let us be honest about what Crashlytics actually gives you out of the box.
You get crash reporting. You get ANR reporting. You get a dashboard. That is genuinely valuable and it costs nothing.
Now list what a real production debugging workflow needs beyond that:
What you need What it costs in the Firebase world Performance traces Firebase Performance Monitoring add-on, sampled What the user was doing Enable Google Analytics, then manually instrument breadcrumbs Screen view tracking Requires Google Analytics In-app bug reports A third party SDK Raw data analysis BigQuery export, billed separately Custom alerting logic Cloud Functions, billed separately Network request monitoring Partially available, sampled
So the SDK count in every one of your apps keeps growing. The number of browser tabs you open during an incident keeps growing. Method count, bundle size and build time grow along with them.
The free tier is real. The completeness is not.
Measure’s argument is simple: instead of five SDKs and five dashboards per platform, use one SDK per platform against one backend, and make session context the default rather than something you instrument by hand.
2. Session Replay changes the debugging loop
This is the single biggest difference, so it deserves the most space.
In Crashlytics, context comes from breadcrumbs you write yourself:
FirebaseCrashlytics.getInstance().log(”User tapped checkout”)
FirebaseCrashlytics.getInstance().setCustomKey(”cart_size”, cartSize)
This works. It also has three problems that every team eventually runs into:
-
You only get context you predicted. You add breadcrumbs where you expect trouble. Crashes happen where you did not expect trouble.
-
It rots. Someone refactors the checkout flow, the log line stays pointing at a screen that no longer exists, and nobody notices for two releases.
-
It is manual labour forever. Every new screen, every new flow, every new feature needs the same instrumentation work again, on every platform you ship.
Measure takes the opposite approach. It auto-captures the session:
-
Gestures (taps, scrolls, swipes)
-
Navigation and screen transitions
-
Lifecycle events
-
HTTP requests and responses
-
Logs
-
CPU and memory signals
Only that last one asks anything of you, and it is a one-line addition where you build your client, not per-screen instrumentation that rots over time.
And it attaches a full replay of that sequence to every crash, ANR and error. Not a sample. Every one. The feature is called Session Replay and it works the same way on every supported platform.
So instead of reading a stack trace and reverse-engineering a user’s path, you watch the timeline: user opened the product screen, scrolled, tapped filter, the API returned a 200 with an empty list, the adapter got an empty list, the crash happened. That is a five second diagnosis instead of a two hour one.
The mental shift is real. You stop asking “can I reproduce this?” and start asking “what actually happened?”
3. Stack traces that cover every thread, on every stack
Most crash reporters give you the stack trace of the thread that blew up. That is enough for a clean null pointer dereference. It is close to useless for concurrency bugs, deadlocks and ANRs, where the interesting information is in what the other threads were doing.
Measure captures the stack trace across every thread. And crucially, it de-minifies correctly per platform:
-
Android. R8 and ProGuard mapping files are uploaded automatically by the Gradle plugin, so you read your original class and method names with line numbers intact.
-
iOS and iPadOS. Traces are symbolicated automatically, turning raw memory addresses back into your Swift and Objective-C function names, files and lines. You upload dSYMs through an Xcode build phase or straight from your
.xcarchive. -
React Native. JavaScript errors are symbolicated from your sourcemaps, and crashes from the native Android and iOS layers underneath are captured and mapped too. Sourcemaps and native mapping files upload automatically.
-
Kotlin Multiplatform. Frames from your shared Kotlin code are included, deobfuscated on Android and symbolicated on iOS, so a crash in shared business logic reads like shared business logic instead of two unrelated mysteries.
-
Flutter. Dart errors and the native crashes underneath both land in the same session.
That last point is what most cross-platform teams actually struggle with. A React Native or KMP crash is rarely purely JavaScript or purely Kotlin. It is a JavaScript call into a native module that failed. If your tool only sees one layer, you spend the debugging session guessing about the other one.
4. Performance traces without sampling
Firebase Performance Monitoring samples. So does Firebase network monitoring. For aggregate dashboards, sampling is fine. For debugging a specific user’s specific bad experience, sampling is the difference between having the data and not having it.
Measure does not sample performance traces or network monitoring by default. You instrument the operations you care about and get waterfall charts showing how they stack up inside a single user flow.
val span = Measure.startSpan(”checkout_flow”)
try {
    val cart = repository.loadCart()
    val quote = pricingApi.getQuote(cart)
    renderCheckout(quote)
} finally {
    span.end()
}
What gets traced depends on the stack, and Measure names it honestly on each platform page: API fetches, database calls and screen rendering on Android and KMP; network requests, disk and database work and rendering on iOS; network requests, native modules, expensive JavaScript and rendering on React Native.
The useful part is not the waterfall itself. It is that the trace carries device and app context and links straight back to the session replay. You see that the checkout API took 4.2 seconds, and you can immediately see it happened on a low-RAM device on a 3G connection while a background sync was running. That is a diagnosis. A p95 latency number is not.
5. The full feature surface
Beyond crashes and traces, Measure bundles the things you would normally buy or build separately. All of these are available across the supported platforms.
Network Performance. Every request your app makes, with HTTP status code distribution over time and endpoints ranked by latency, error rate and frequency. Your slowest and most error-prone APIs surface without you writing an interceptor from scratch.
Bug Reports. Triggered by a device shake or by an SDK call from your own button. Each report captures device info, app version, network conditions and screenshots alongside whatever the user typed, and links to the complete session replay.
// Wire it to your own “Report a problem” button
Measure.launchBugReportActivity(activity)
If you have ever received a support ticket that said “app not working plz fix”, you understand why this is valuable.
User Journeys. Screen transitions get mapped automatically into flow diagrams, and the exception view overlays where issues interrupt those flows. This is how you decide what to fix first: not by crash count, but by which broken screen sits on the path to your revenue.
App Health. Crash-free and ANR-free session rates, adoption per release, error rates, app size, and launch times split across cold, warm and hot starts.
Worth being precise here: your Android app and your iOS app are separate apps in Measure, so each gets its own dashboard. They look the same and measure the same things, which is the actual win. Today most teams read Android vitals in the Play Console and then have nothing equivalent on the App Store side, so “how healthy is our iOS build” gets answered with a different tool, a different metric definition, or a shrug. Same dashboard shape on both platforms means the two numbers are finally comparable.
Adaptive Capture. This one is quietly clever. You can dial data collection up or down from the dashboard without shipping an app update. Turn capture up during a risky rollout, turn it down when things are stable. Anyone who has ever needed a config change and had to wait five days for a Play Store staged rollout or an App Store review will appreciate this.
MCP Server and Measure Agent. Measure exposes crashes, ANRs, traces and session replays to coding agents over MCP. That means you can point Claude Code, Codex, Cursor, Antigravity or an open source agent at a production crash and have it read the session context directly, instead of you copy-pasting stack traces into a chat window. Agentic triage pipelines become an afternoon project instead of a quarter.
6. Integration, stack by stack
This is where the multi-platform story stops being marketing and becomes real. Here is what setup looks like on each one.
Android
Requirements: AGP 8.1.0 or newer, minSdk 21, targetSdk 35.
Credentials go in the manifest:
<!-- Inside the <application> tag -->
<meta-data
    android:name=”sh.measure.android.API_KEY”
    android:value=”YOUR_API_KEY” />
<meta-data
    android:name=”sh.measure.android.API_URL”
    android:value=”YOUR_API_URL” />
Then the dependency and the plugin:
// app/build.gradle.kts
plugins {
    id(”sh.measure.android.gradle”) version “0.13.0”
}

dependencies {
    implementation(”sh.measure:measure-android:0.19.0”)
}
The plugin is what instruments at build time and uploads your R8 and ProGuard mapping files automatically. Then initialize as early as you can:
import sh.measure.android.Measure
import sh.measure.android.config.MeasureConfig

class MyApp : Application() {
    override fun onCreate() {
        super.onCreate()
        Measure.init(this, MeasureConfig())
    }
}
Early initialization is what lets the SDK catch early crashes and report accurate cold start numbers. Verify with a deliberate test crash:
Handler(Looper.getMainLooper()).postDelayed({
    throw RuntimeException(”Test crash from Measure”)
}, 2000)
The two second delay gives the SDK time to flush the event. Remove it once the crash appears in your dashboard.
Four files touched. Note what is missing: no breadcrumb instrumentation, no analytics SDK, no screen tracking setup. Gestures, navigation and lifecycle events are captured from this point on.
The one thing you do still wire up is network monitoring. Measure needs an interceptor attached to your HTTP client to see requests, so add it where you build your client, alongside whatever logging or auth interceptors you already have. One line, one place, done once.
Flutter
The Flutter SDK ships as measure_flutter on pub.dev, published by a verified measure.sh publisher under Apache 2.0.
dependencies:
  measure_flutter: ^0.6.0
Initialization wraps your app rather than sitting beside it:
Future<void> main() async {
  await Measure.instance.init(
    () => runApp(
      MeasureWidget(child: MyApp()),
    ),
    config: const MeasureConfig(
      enableLogging: true,
      traceSamplingRate: 1,
      samplingRateForErrorFreeSessions: 1,
    ),
    clientInfo: ClientInfo(
      apiKey: “YOUR_API_KEY”,
      apiUrl: “YOUR_API_URL”,
    ),
  );
}
Screen views hook into Flutter’s own navigation system with an observer, which means you get navigation tracking without touching every route:
MaterialApp(
  navigatorObservers: [MsrNavigatorObserver()],
  home: HomeScreen(),
);
And if you use Dio, network tracking is one interceptor:
final dio = Dio();
dio.interceptors.add(MsrInterceptor());
For other HTTP clients you call Measure.instance.trackHttpEvent yourself. Manual screen tracking is available too via Measure.instance.trackScreenView("Home").
Notice how little of this is Measure-specific ceremony. It plugs into the idioms Flutter developers already use.
iOS and iPadOS
The iOS SDK is distributed through Swift Package Manager and CocoaPods:
target ‘MyApp’ do
  pod ‘measure-sh’, ‘~> 0.12’
end
The piece worth planning for is dSYM upload. You can wire it into an Xcode build phase so it happens on every archive, or upload straight from your .xcarchive. Do this on day one, because symbolication is the difference between a readable crash and a wall of hex addresses, and it is the step teams most often postpone and then regret.
Everything else is the same product: session timelines with gestures, navigation, network and lifecycle, all-thread stack traces, traces, bug reports, journeys, app health. iPadOS gets first-class treatment rather than being an afterthought of the iPhone build.
React Native
This one is worth calling out because RN monitoring is usually where tooling falls apart.
Measure supports vanilla React Native and Expo, and both Hermes and JavaScriptCore. That combination matters. Plenty of monitoring tools quietly assume one engine or fail on Expo managed workflows.
Sourcemaps and native mapping files upload automatically, and crashes are captured on both sides of the bridge. So a native crash triggered by a JavaScript call shows up as one issue with one session, not as two disconnected reports on two dashboards.
Kotlin Multiplatform
For KMP the pitch is specific: crashes carry frames from your shared Kotlin code, deobfuscated on Android and symbolicated on iOS. Since shared business logic is exactly where KMP teams concentrate their risk, having that layer readable in production is the whole point.
You use Measure from shared Kotlin code and get one set of crash and performance data across both platform targets.
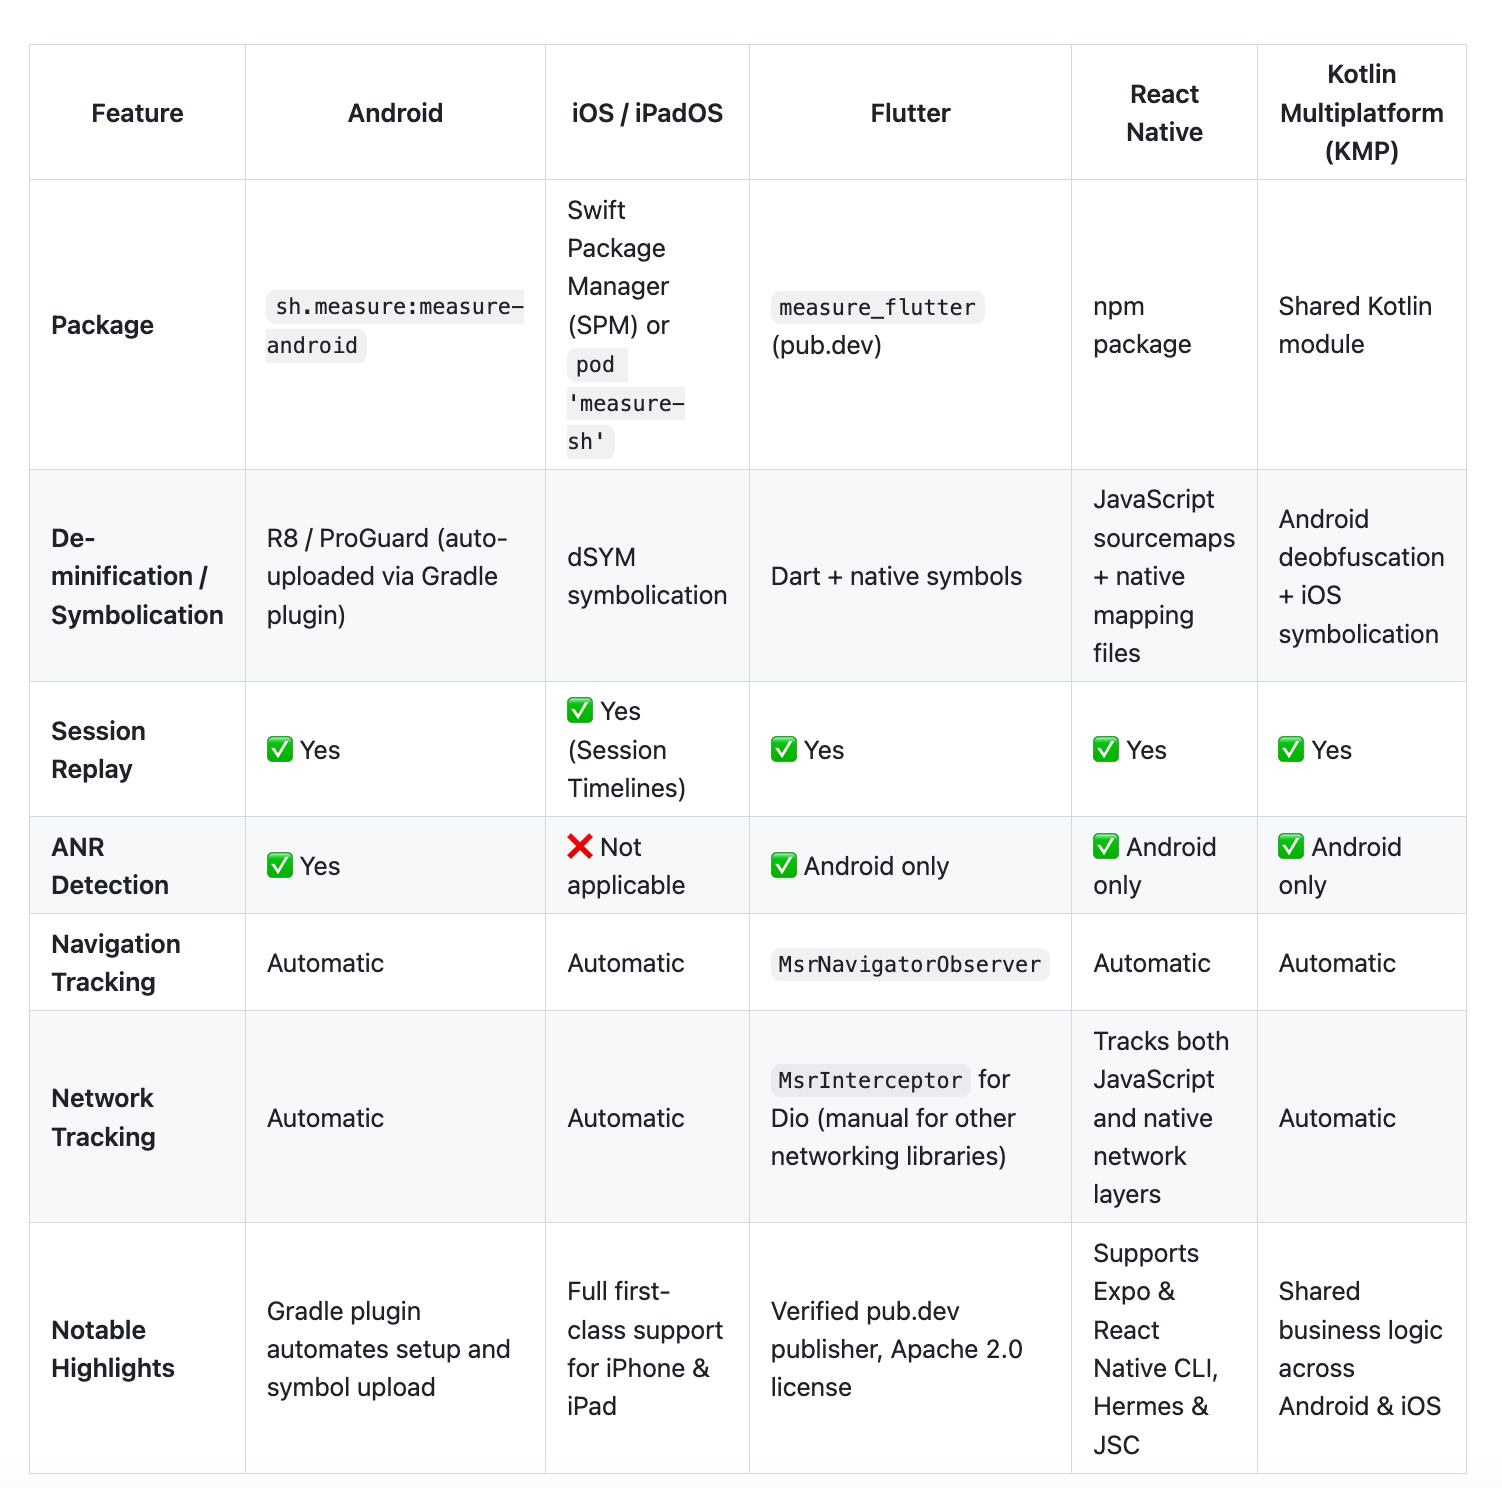
7. Which stack gets what
Every platform gets the same core product. Here is the practical breakdown of the platform-specific bits.
8. Open source, and what that actually means here
Crashlytics SDKs are on GitHub. The backend and the dashboard are not. They run on Google’s infrastructure and you get what you are given.
Measure is Apache 2.0 across the whole stack: SDKs, backend and dashboard. That is not a marketing checkbox, it has three practical consequences.
You can audit the pipeline. For teams in fintech, healthcare or anything under a data residency regime, being able to read exactly what is collected and where it goes is not a nice-to-have. It is what gets you through a security review.
You can self-host. Run the whole thing on your own servers. Your crash data, your session replays, your user journeys never leave your infrastructure.
You can fix it yourself. Public roadmap, public issue tracker, and a PR from you is a legitimate path to getting your edge case handled. With a closed platform, your edge case is a support ticket that competes with every other customer’s priorities.
The repo sits at over 1.3k stars with a visible group of maintainers, an active contributor list, and the Android, iOS, Flutter, React Native and KMP SDKs all living in the same monorepo. That last detail matters more than it sounds: platform SDKs that ship from one repo tend to stay closer to feature parity than SDKs maintained as separate afterthought projects.
9. The pricing math
Crashlytics is free. Measure has a free tier and a paid tier. So let us compare honestly.
Measure Free: 5 GB per month, 30 day retention, MCP server included, no credit card.
Measure Pro: 50 dollars per month, 25 GB included, 90 day retention, MCP server and Measure Agent, additional data at 2 dollars per GB per month.
No per-seat charges. No pre-purchased bundles of crashes or spans. It is priced on data volume, and Adaptive Capture is the lever you pull to control that volume.
Two things follow from this that matter for multi-platform teams.
Pricing is per data, not per app or per platform. Your Android app, your iOS app and your Flutter side project all draw from the same allowance. There is no “buy a second seat for the iOS team” step.
The comparison people usually get wrong is “free versus 50 dollars”. The real comparison is:
-
Crashlytics for crashes: free
-
Plus Firebase Performance Monitoring
-
Plus Google Analytics for user context
-
Plus BigQuery export for any real data analysis, billed on storage and query
-
Plus Cloud Functions for custom alerting
-
Plus a third party bug reporting SDK
-
Plus the engineering hours spent maintaining breadcrumb instrumentation across releases, on every platform you ship
For a small app with modest traffic, Measure’s free tier likely covers you entirely and you consolidate five tools into one. For a larger app, you are comparing a predictable usage-based bill against a GCP bill that is genuinely hard to forecast, plus the ongoing labour cost of manual instrumentation multiplied by your stack count.
That last cost is the one nobody budgets for and everybody pays.
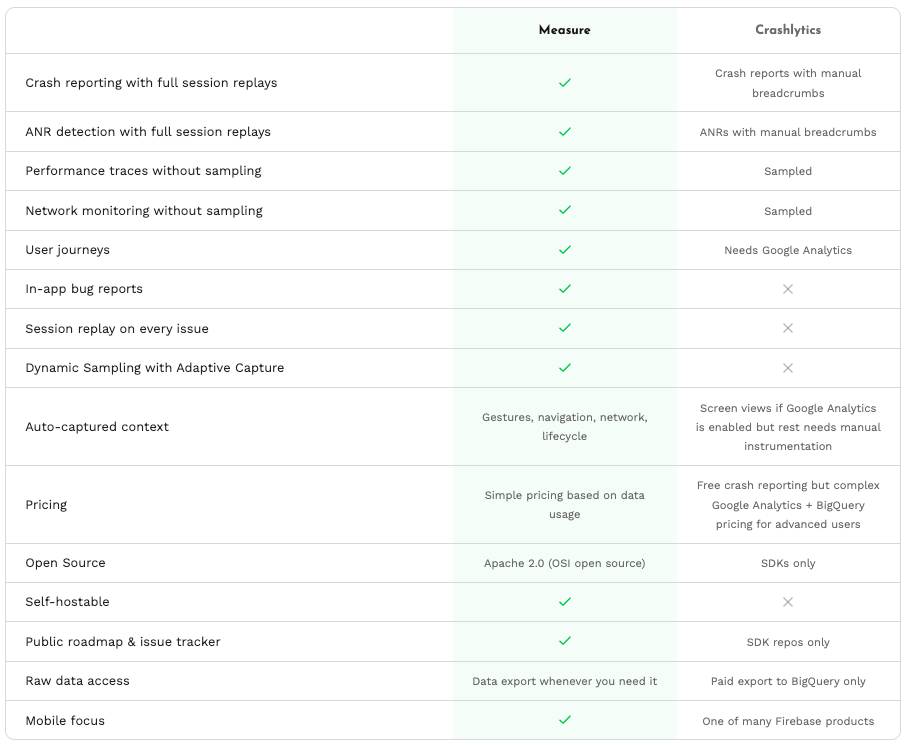
10. Head to head
11. When Crashlytics is still the right call
I am not going to pretend this is one-sided. Stay on Crashlytics if:
-
You are already deep in the Firebase ecosystem for auth, Firestore, Remote Config and messaging, and the operational simplicity of one vendor is worth more to you than better context.
-
You ship on a platform Measure does not cover. Unity games are the obvious example.
-
Your app is small and crash volume is low. Stack trace plus device info genuinely solves most of your issues.
-
Your organisation has procurement rules that make adding any new vendor a three month process.
-
Your team has no bandwidth to evaluate anything right now. That is a legitimate constraint, not a failure.
The honest test is this: the last five production bugs you shipped a fix for, how many did you diagnose from the stack trace alone, and how many needed you to guess, reproduce locally, or ask a user what they did?
If that second number is most of them, you have a context problem, and no amount of better crash grouping is going to solve a context problem.
Closing thought
The mobile monitoring space has spent a decade optimising the wrong thing. We got very good at capturing and grouping stack traces, and barely moved on the harder question of reconstructing what happened. And as teams fragmented across native, Flutter, React Native and KMP, we mostly solved that by buying more tools.
Measure’s bet is that the interesting information was never in the exception. It was in the thirty seconds before it, and it should look the same whether your app is written in Kotlin, Swift, Dart or TypeScript.
Given that it is free to start, Apache 2.0, self-hostable, and roughly four files of setup on any of the supported stacks, the cost of finding out whether that bet holds for your app is close to zero.
Try it on one app, ship it to production, and wait for your next real crash. That is the only benchmark that means anything.
Useful links
-
Measure: measure.sh
-
Crashlytics comparison: measure.sh/crashlytics-alternative
-
Integration docs: measure.sh/docs
-
Platform pages: Android · iOS · iPadOS · Flutter · React Native · KMP
-
Flutter package: pub.dev/packages/measure_flutter
-
GitHub: github.com/measure-sh/measure
-
Pricing: measure.sh/pricing
If you found this useful, follow me for more deep dives on Android, mobile architecture and AI for mobile developers.
Level Up Your Mobile Developer Interview !
Mastering AI for Android Developers
Your complete hands-on guide to integrating AI into Android apps — covering Generative AI, LLMs, on-device intelligence, AI APIs, real-world use cases, and practical implementation with modern Android development.
👉 Grab your copy now:
https://medium.com/@anandgaur2207/mastering-ai-for-android-developers-5cc6d62e7d21
Cracking the Mobile System Design Interview Book
Your complete practical guide to mastering Mobile System Design Interviews — covering scalable architecture, Android & iOS system design concepts, high-level design strategies, low-level design patterns, performance optimization, offline-first architecture, real-world case.
👉 Grab your copy now:
https://medium.com/@anandgaur2207/cracking-the-mobile-system-design-interview-book-8ff043db0359
Data Structures & Algorithms for Mobile App Developers Book
Master the Data Structures & Algorithms concepts every Android, iOS, Flutter, React Native, and KMP developer should know. Learn arrays, linked lists, trees, graphs, dynamic programming, searching, sorting, recursion, and problem-solving techniques with practical coding examples and interview-focused explanations.
👉 Grab your copy now:
https://medium.com/@anandgaur2207/data-structures-algorithms-for-mobile-app-developers-74db0ae17376?sharedUserId=anandgaur2207
Crack Android Interviews Like a Pro
Your complete Android interview preparation book — packed with real questions, deep explanations, and practical insights to help you stand out.
👉 Grab your copy now:
https://medium.com/@anandgaur2207/crack-android-interviews-with-confidence-the-only-handbook-youll-need-b87ec525f19c
iOS Developer Interview Handbook
From Swift fundamentals to advanced iOS concepts — a complete handbook to help you prepare smartly and confidently.
👉 Explore the book:
https://medium.com/@anandgaur2207/crack-ios-developer-interviews-with-confidence-the-complete-ios-developer-handbook-f1eabc3d7a21
Flutter Developer Interview Handbook
Ace your next Flutter interview with scenario-based questions, detailed explanations, and hands-on examples that make you stand out.
👉 Explore the book:
https://medium.com/@anandgaur2207/crack-flutter-developer-interviews-with-confidence-the-complete-flutter-developer-interview-6cb53996832c
React Native Developer Interview Handbook
Crack your next React Native interview with confidence!
This guide is packed with scenario-based questions, detailed explanations, and hands-on examples to help you stand out and succeed.
👉 Explore the book:
https://medium.com/@anandgaur2207/react-native-interview-crack-your-next-interview-with-confidence-0d7255a20fe1
Need 1:1 Career Guidance or Mentorship?
If you’re looking for personalized guidance, interview preparation help, or just want to talk about your career path in mobile development — you can book a 1:1 session with me on Topmate.
I’ve helped many developers grow in their careers, switch jobs, and gain clarity with focused mentorship. Looking forward to helping you too!
Found this helpful? Don’t forgot to clap 👏 and follow me for more such useful articles about Android development and Kotlin or buy us a coffee here ☕
If you need any help related to Mobile app development. I’m always happy to help you.
Follow me on: